
I stared at squiggly lines…
until VUV started
to make sense.
A practicing chromatographer's simple breakdown of the LUMA detector (VUV Analytics) — the mental model that finally made it click.
mai-alchemy.com1 / 8"Where are the peaks?"
As a chromatographer, I was used to clean peaks on a chromatogram. When I first looked at LUMA data I saw this — the spectrum drawn as a squiggly line across wavelengths — and kept asking the same thing.
This is the view that threw me — the "average" spectrum as a line across wavelength. It doesn't look like a peak, and as chromatographers, we want to see a peak.
mai-alchemy.com2 / 8Front view + side view.
The peak is the front view — the analyte over time. Click a point in it and you get the side view: the spectrum. And that scary line from the last slide? It's just the band view drawn as a curve — the same 12 wavelengths.
mai-alchemy.com3 / 8Do you know what your detector's
sampling rate is for?
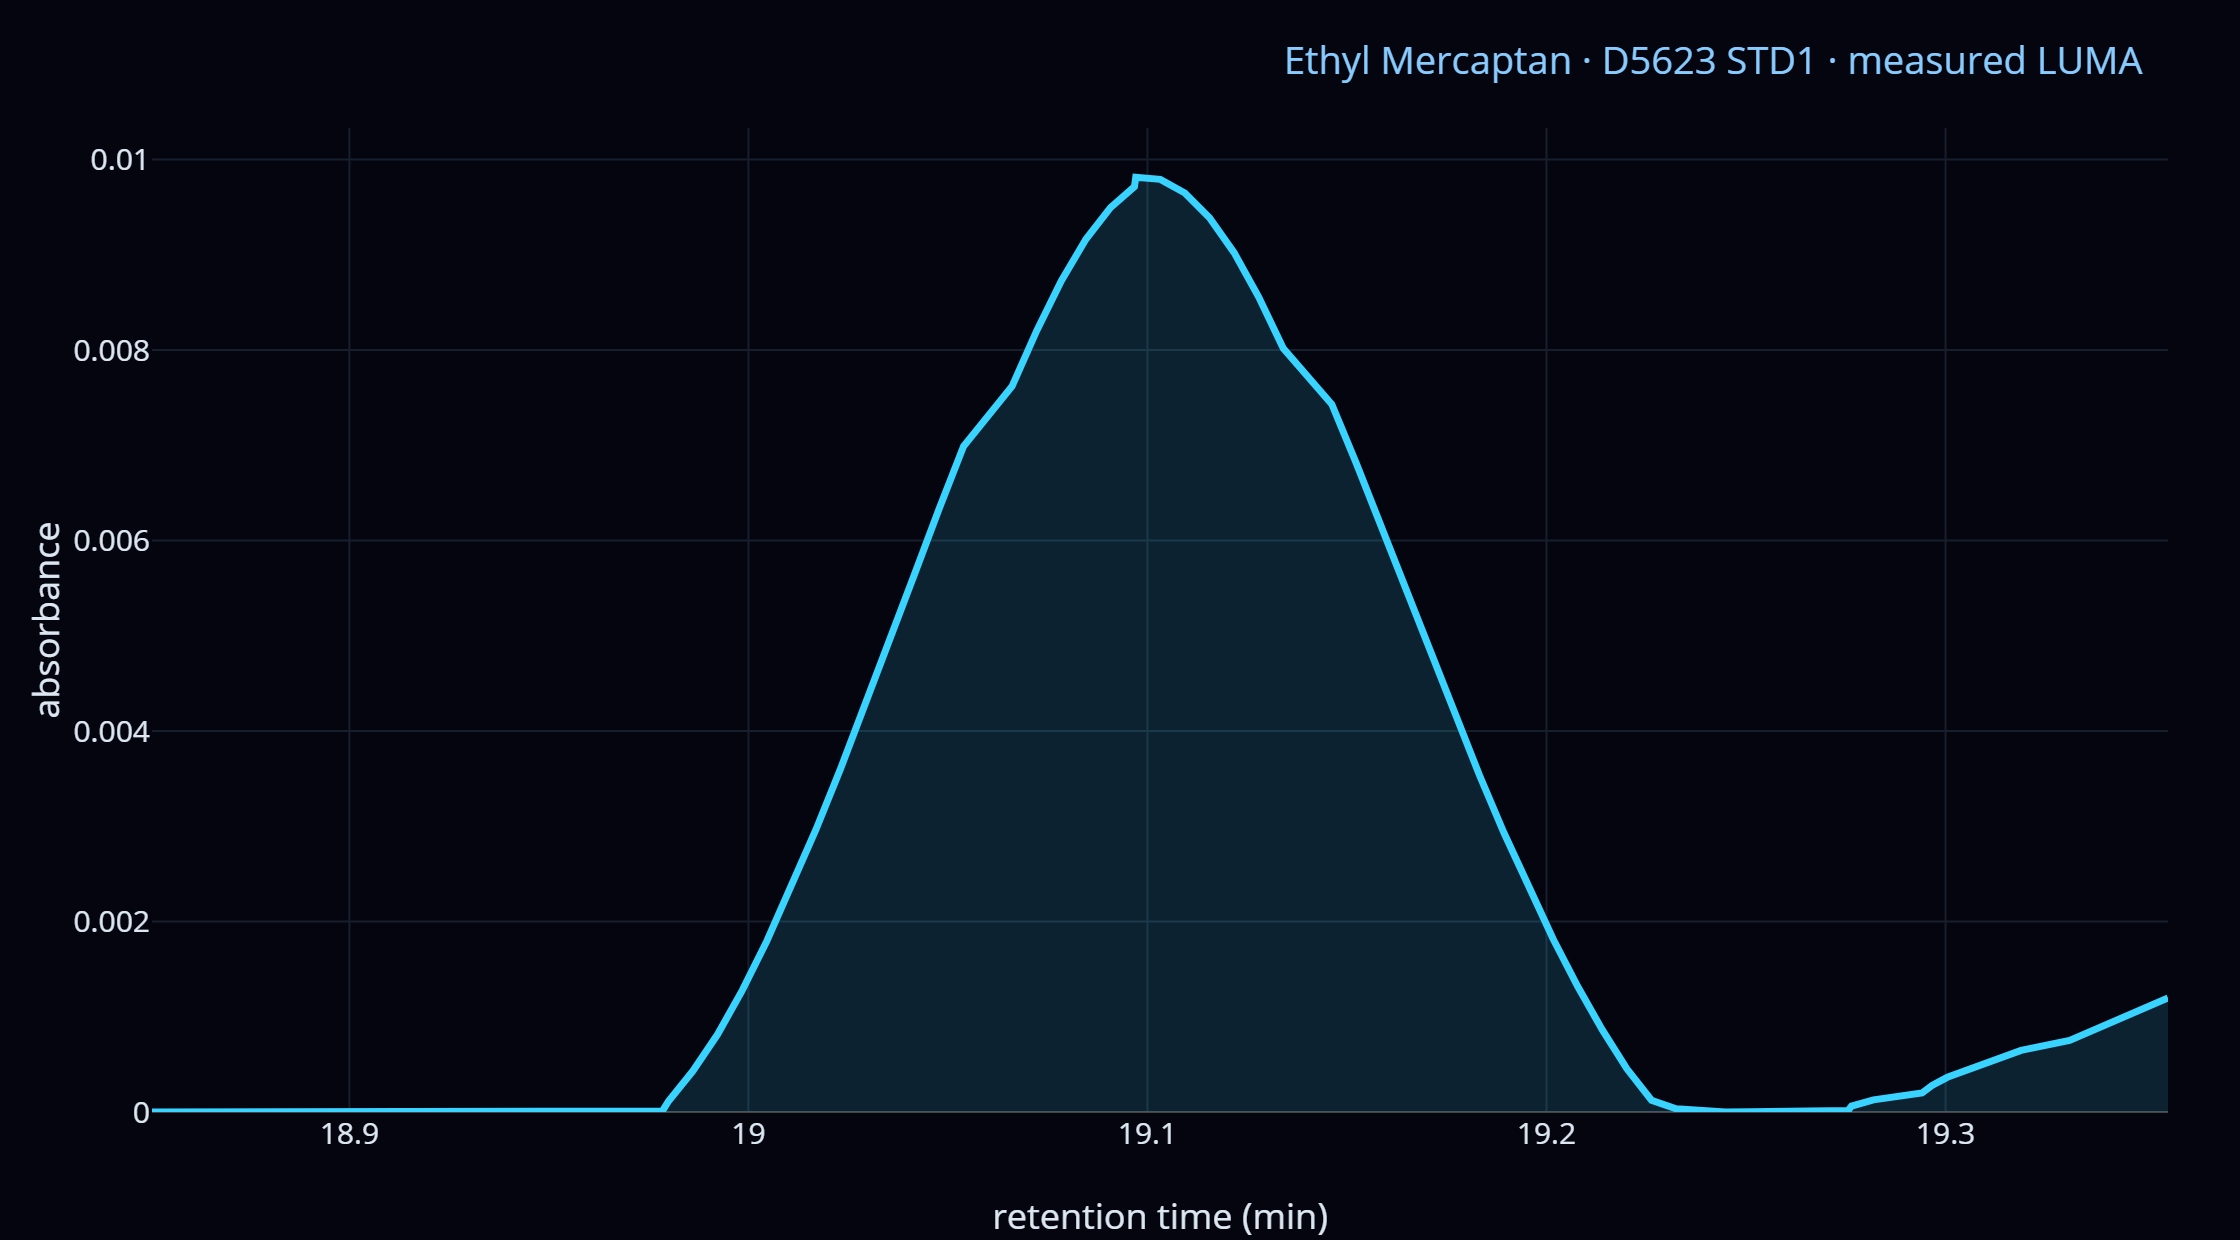
Real capture · one sulfur peak — Ethyl Mercaptan, ASTM D5623 — on a LUMA VUV detector. It looks like a smooth trace. But look closer…
mai-alchemy.com4 / 8It's not a trace —
it's a series of dots.
The sampling rate is how many times per second the detector captures data. 10 Hz = 10 dots every second. And each dot isn't one number — it's a full 12-band spectrum. Rate + sensitivity is a big part of what makes the LUMA so powerful.
mai-alchemy.com5 / 812 wavelengths through
the flow cell.
All 12 wavelengths pass through the sample in the flow cell. The molecule absorbs some of them — those come out weaker, the rest pass through. The pattern of what it absorbs is its fingerprint — the side view.
A simplified simulation. A molecule absorbs light only at specific wavelengths set by its structure — the more strongly a band is absorbed, the taller it reads, and by Beer's law absorbance climbs with concentration. The pattern of what it absorbs is its fingerprint. (Drawn schematically to build intuition, not as literal absorption physics.)
mai-alchemy.com6 / 8Measured vs. library.
Every compound has its own 12-band fingerprint. So a measured spectrum is lined up against a library of references — a close match across all 12 bands names the compound.
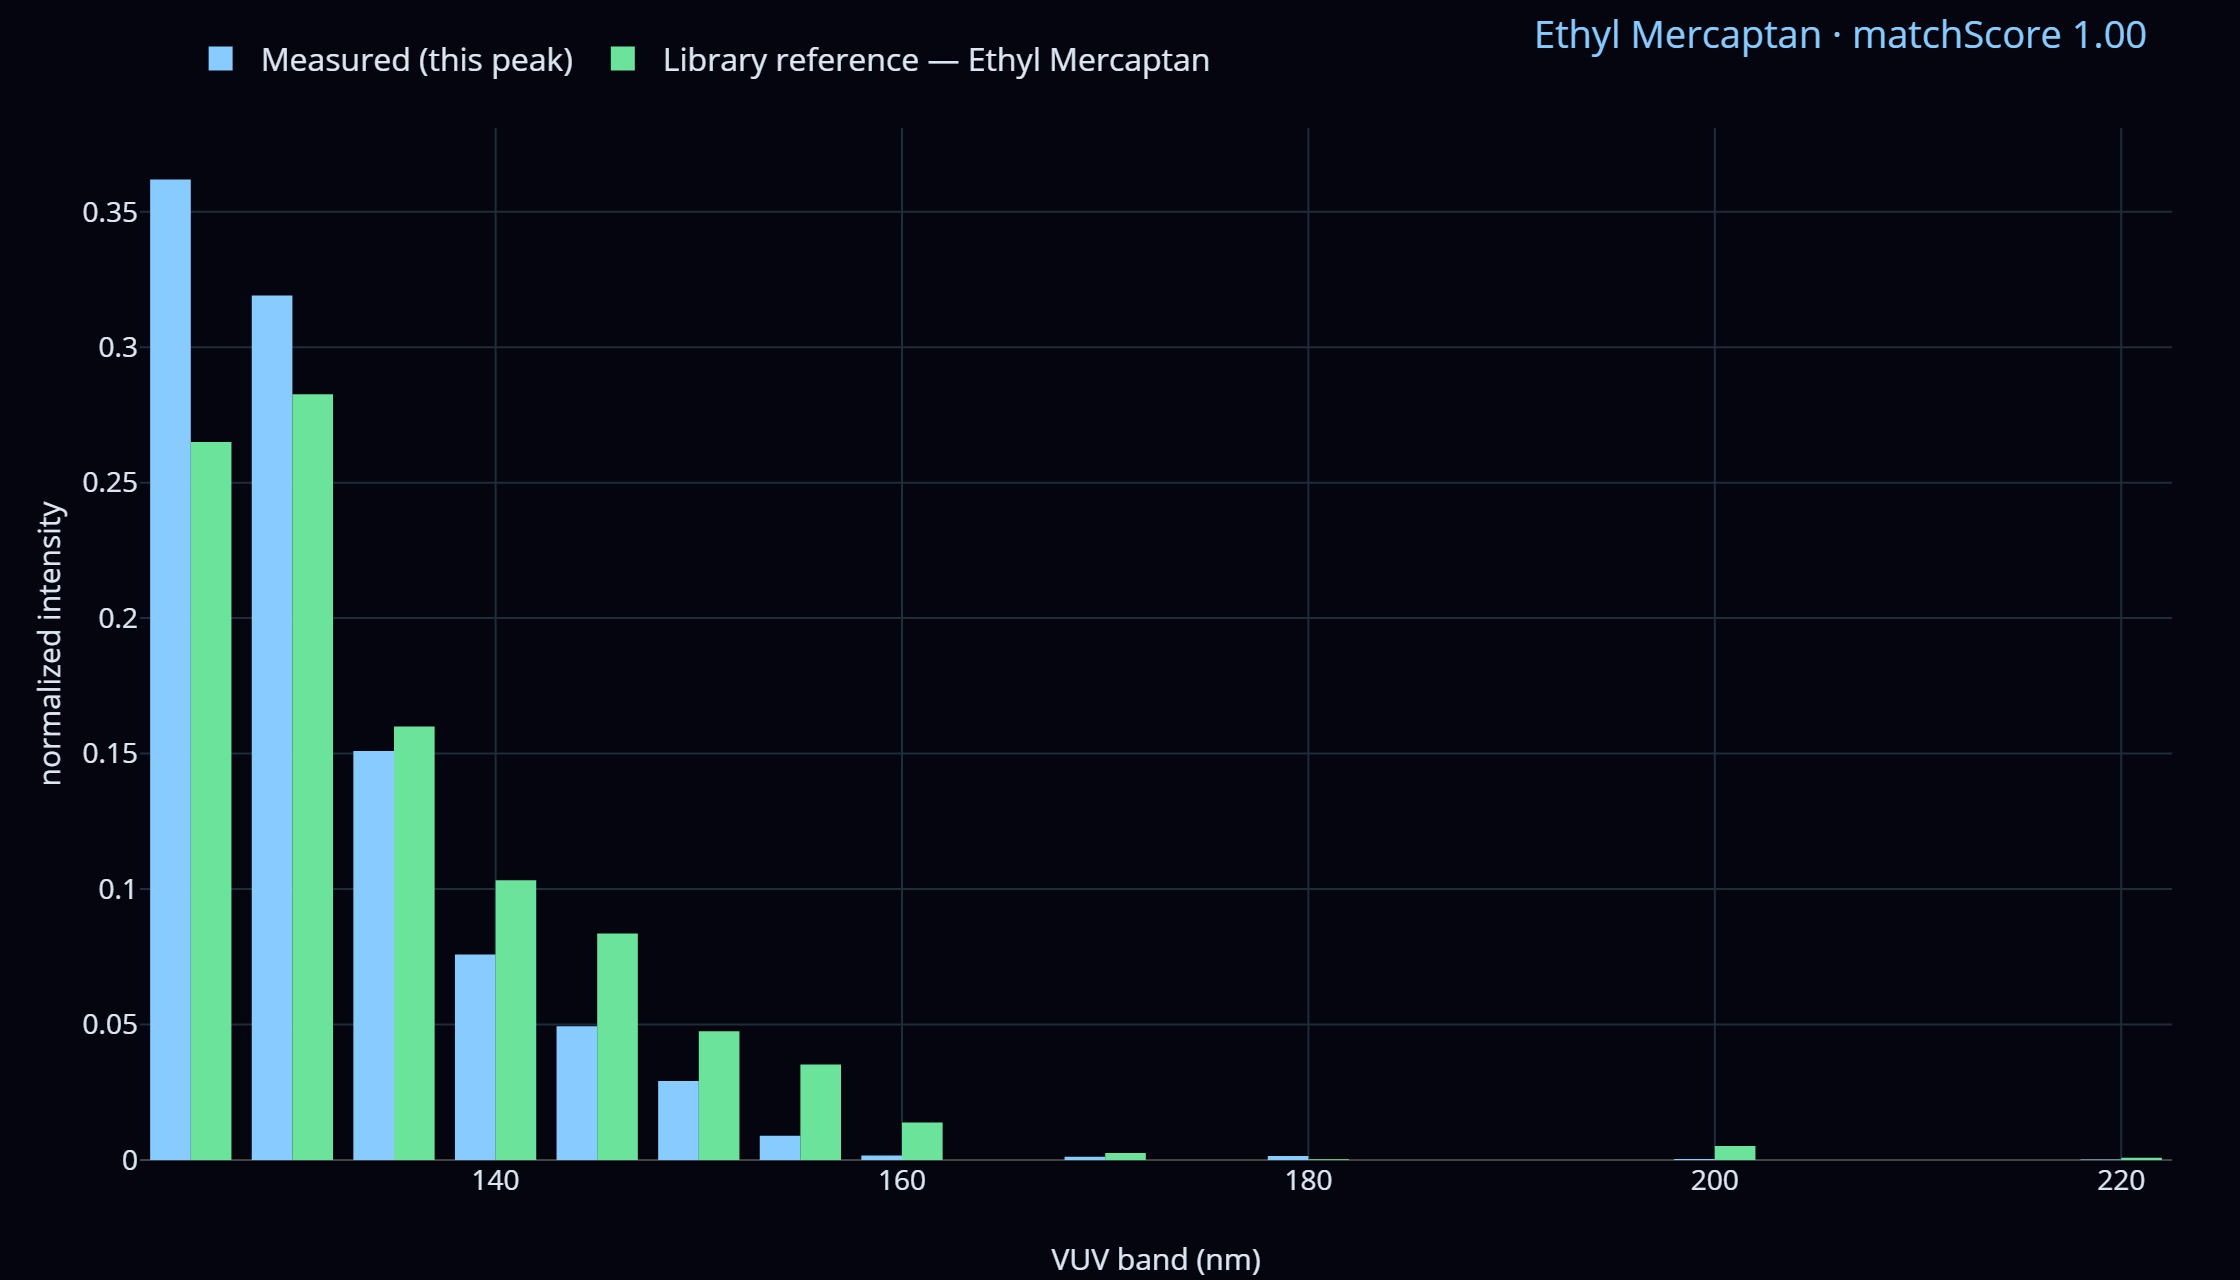
Real capture · a measured D5623 sulfur peak (blue) lined up against its library reference (green) across the 12 VUV bands. Band for band they track — that's the identification.
mai-alchemy.com7 / 8
To read the data,
you need perspective.
A peak tells you how much. The spectrum tells you what. VUV/LUMA gives you both — the front view and the side view of every peak.
Not just how much — what it is.
Still learning with every run — but once you have both views, you can't unsee it.
Have an application in mind for the LUMA? Let's talk — I may be able to help.
📧 info@mai-alchemy.com
Or drop your questions and VUV / LUMA experiences below. 👇
mai-alchemy.com8 / 8