
When I first heard about the LUMA detector, I was inspired. I thought: this answers so many problems. There are analyses that are a genuine pain — sulfur speciation by SCD, refinery gas analysis, oxygenates, hydrocarbon analysis, water in LPG — each with its own instrument, its own method, its own headaches. I looked at LUMA and thought, what if I could do all of those on one instrument, in one injection?
A few months later, my proof-of-concept method — five analyses combined on a single injection, something that had never been done — won Presentation of the Year at the 2024 Gulf Coast Conference. My colleague was in the audience. When I finished, he just smiled.
That's what this detector can do. So why does almost nobody use it that way?
The richness is captured by the hardware — and thrown away by the software.
Here's the problem, and it's not the detector's fault. A LUMA emits an information-rich signal: at every moment in the run, it reports how strongly your compound absorbs across 12 different wavelength bands of vacuum-ultraviolet light. That's not one number. It's a little spectrum — a fingerprint — at every retention time.
But every mainstream chromatography data system treats that data as 12 separate chromatograms — twelve lines on a plot — instead of what it actually is: a low-resolution spectral dimension. The software plots the bands and ignores what they mean. The molecule's signature is right there in the data, and the software steps right over it.
That's why LUMA feels like a black box. The gap was never the hardware. It was that no one built the software to read what the hardware was always capable of seeing.
Every detector answers "how much?" VUV answers "what is it?"
A flame ionization detector sees heat. A thermal conductivity detector sees a change in the gas stream. They tell you a peak is there, and how big it is. They cannot tell you what it is.
Vacuum-UV light is different. It carries enough energy to push a molecule's bonding electrons up into higher-energy orbitals — and which wavelengths a molecule absorbs depends entirely on the bonds it's made of. Three kinds of electronic transition land in three parts of the VUV, and each one is a different chemistry:
| Transition | Wavelength | What absorbs it |
|---|---|---|
| σ → σ* | ~125–140 nm | Single C–C / C–H bonds — every molecule; the whole story for paraffins |
| π → π* | ~140–190 nm | Double bonds and aromatic rings — olefins and aromatics, strong and structured |
| n → σ* | ~150–220 nm | Lone-pair electrons on S, O, N — where sulfurs and oxygenates announce themselves |
So the shape across the 12 bands is a readout of a molecule's electronic structure. Paraffins, olefins, naphthenes, aromatics, sulfur species — each lights up a different silhouette. The detector doesn't just tell you a molecule is there. It effectively sees the bonds.
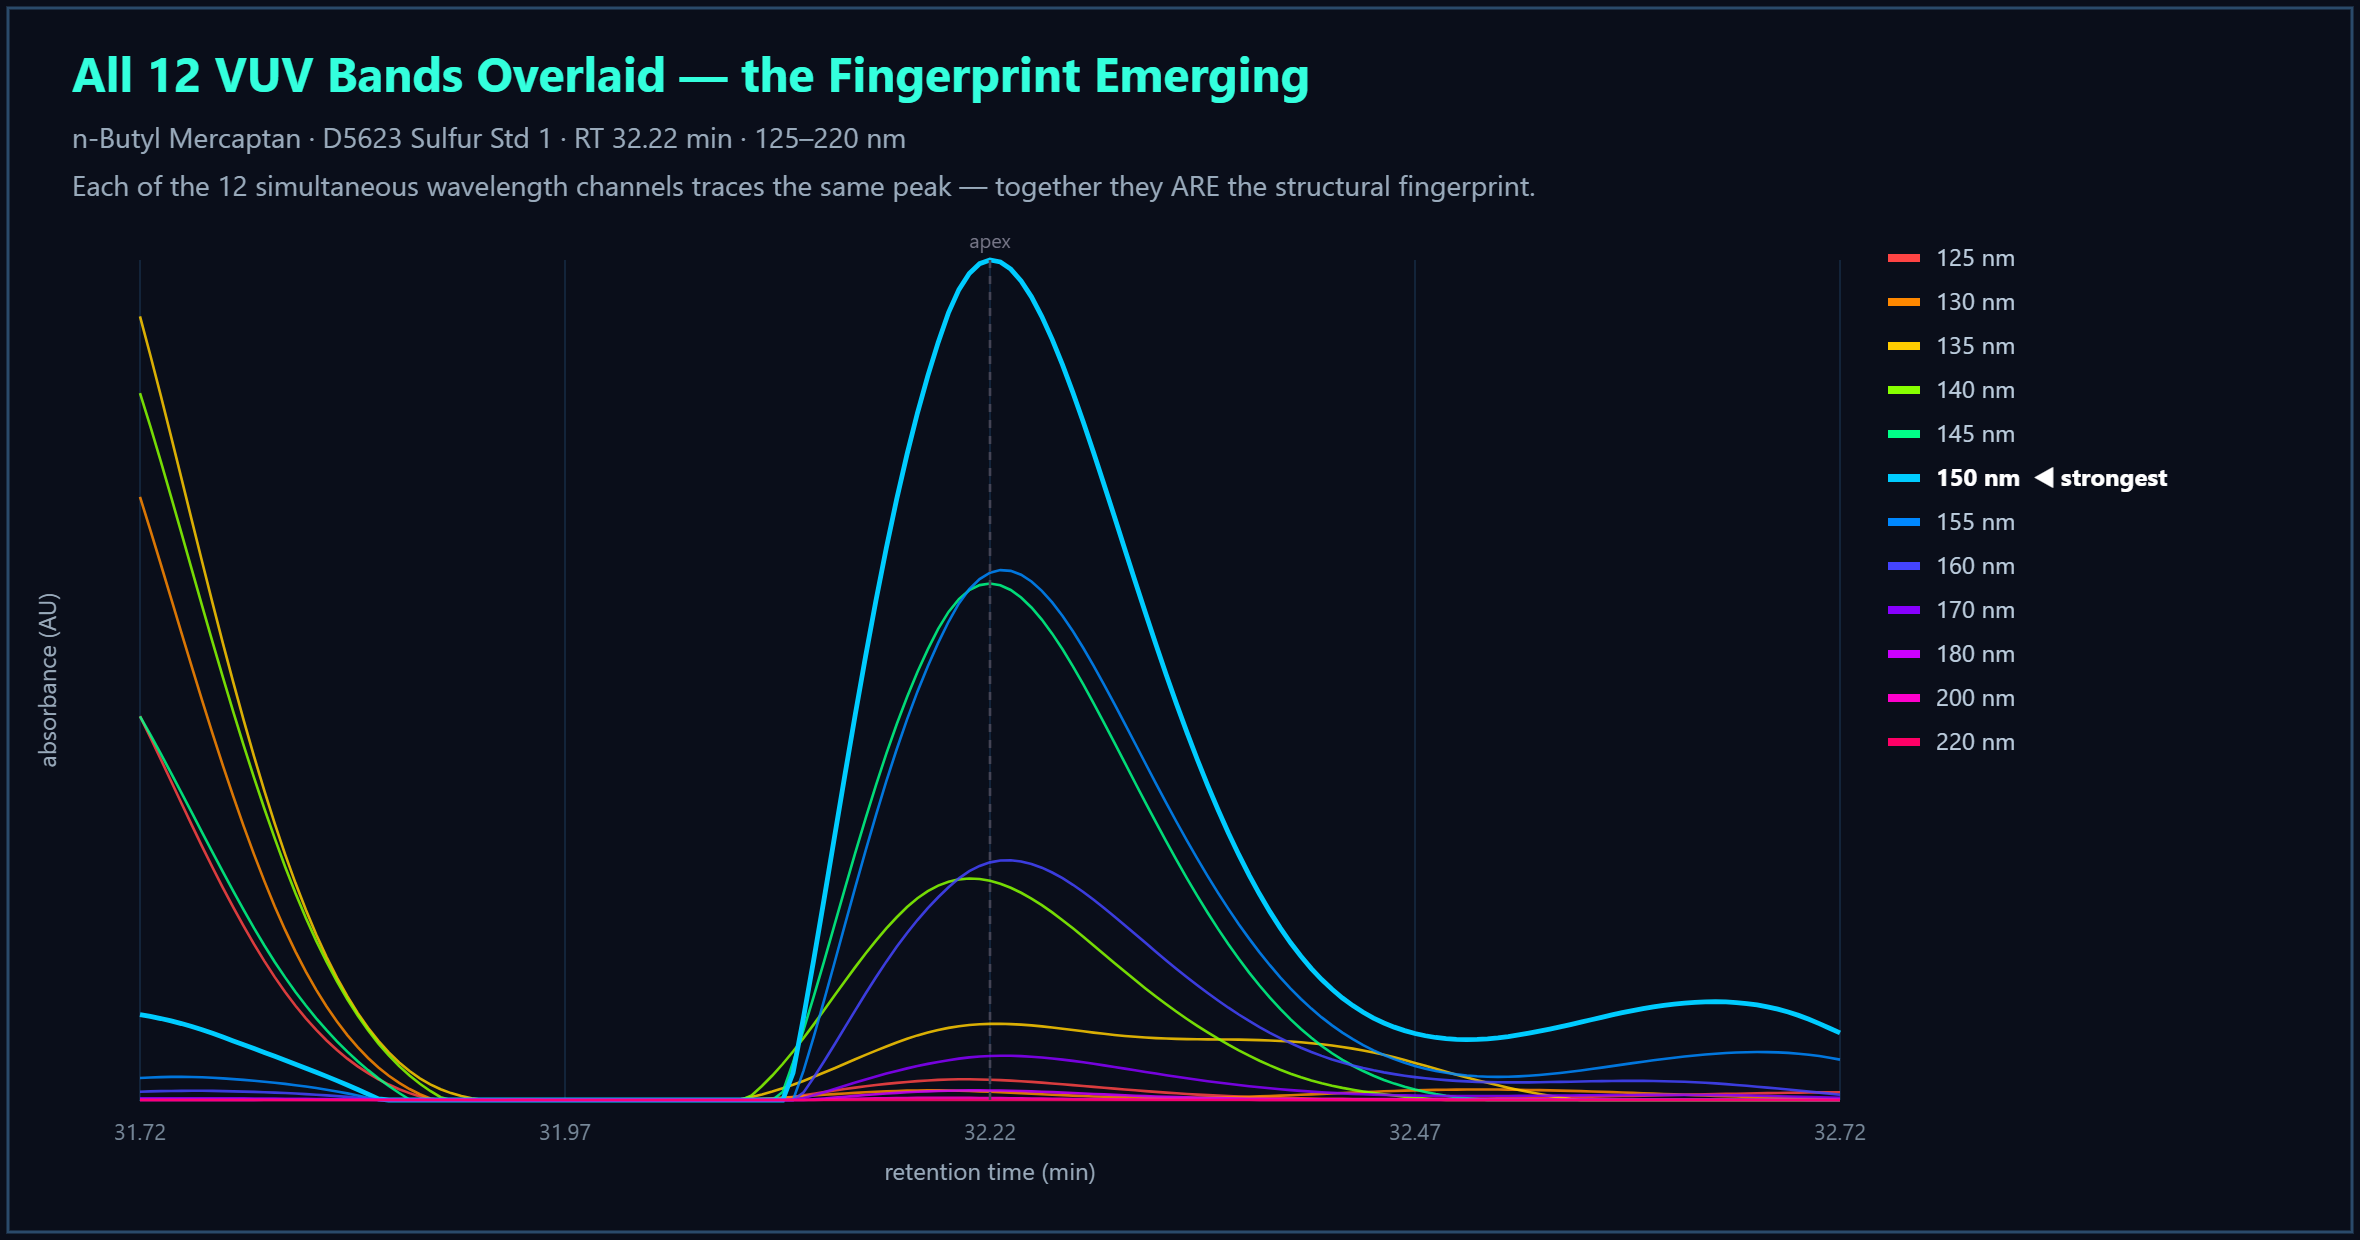
One channel draws a line. Twelve channels draw a surface.
A single-channel detector gives you one value per moment — a curve of signal versus time. The LUMA gives you a 12-point spectral vector at every moment. Stack those up and the data isn't a line anymore. It's a surface: time × wavelength × absorbance. Three dimensions.
That third dimension is where identity lives — and it lives in the ratios between the bands, which don't change with concentration. If you've run a mass spec, this will feel familiar: the band ratios are the qualifying ions. They're how you confirm you have what you think you have.
Here's exactly how VUV Analytics describes it: LUMA acquires data across 12 discrete wavelength bands, spanning roughly 120–500 nm. Each band can be configured as its own output channel. And here's the tell, in the vendor's own words — each channel is represented as an individual chromatogram in your CDS. [1]
Twelve lines on a plot, and a note that you can do math between them. That's the offer. But those twelve channels aren't twelve separate signals — they're twelve slices of one spectral shape, and the shape is the molecule:
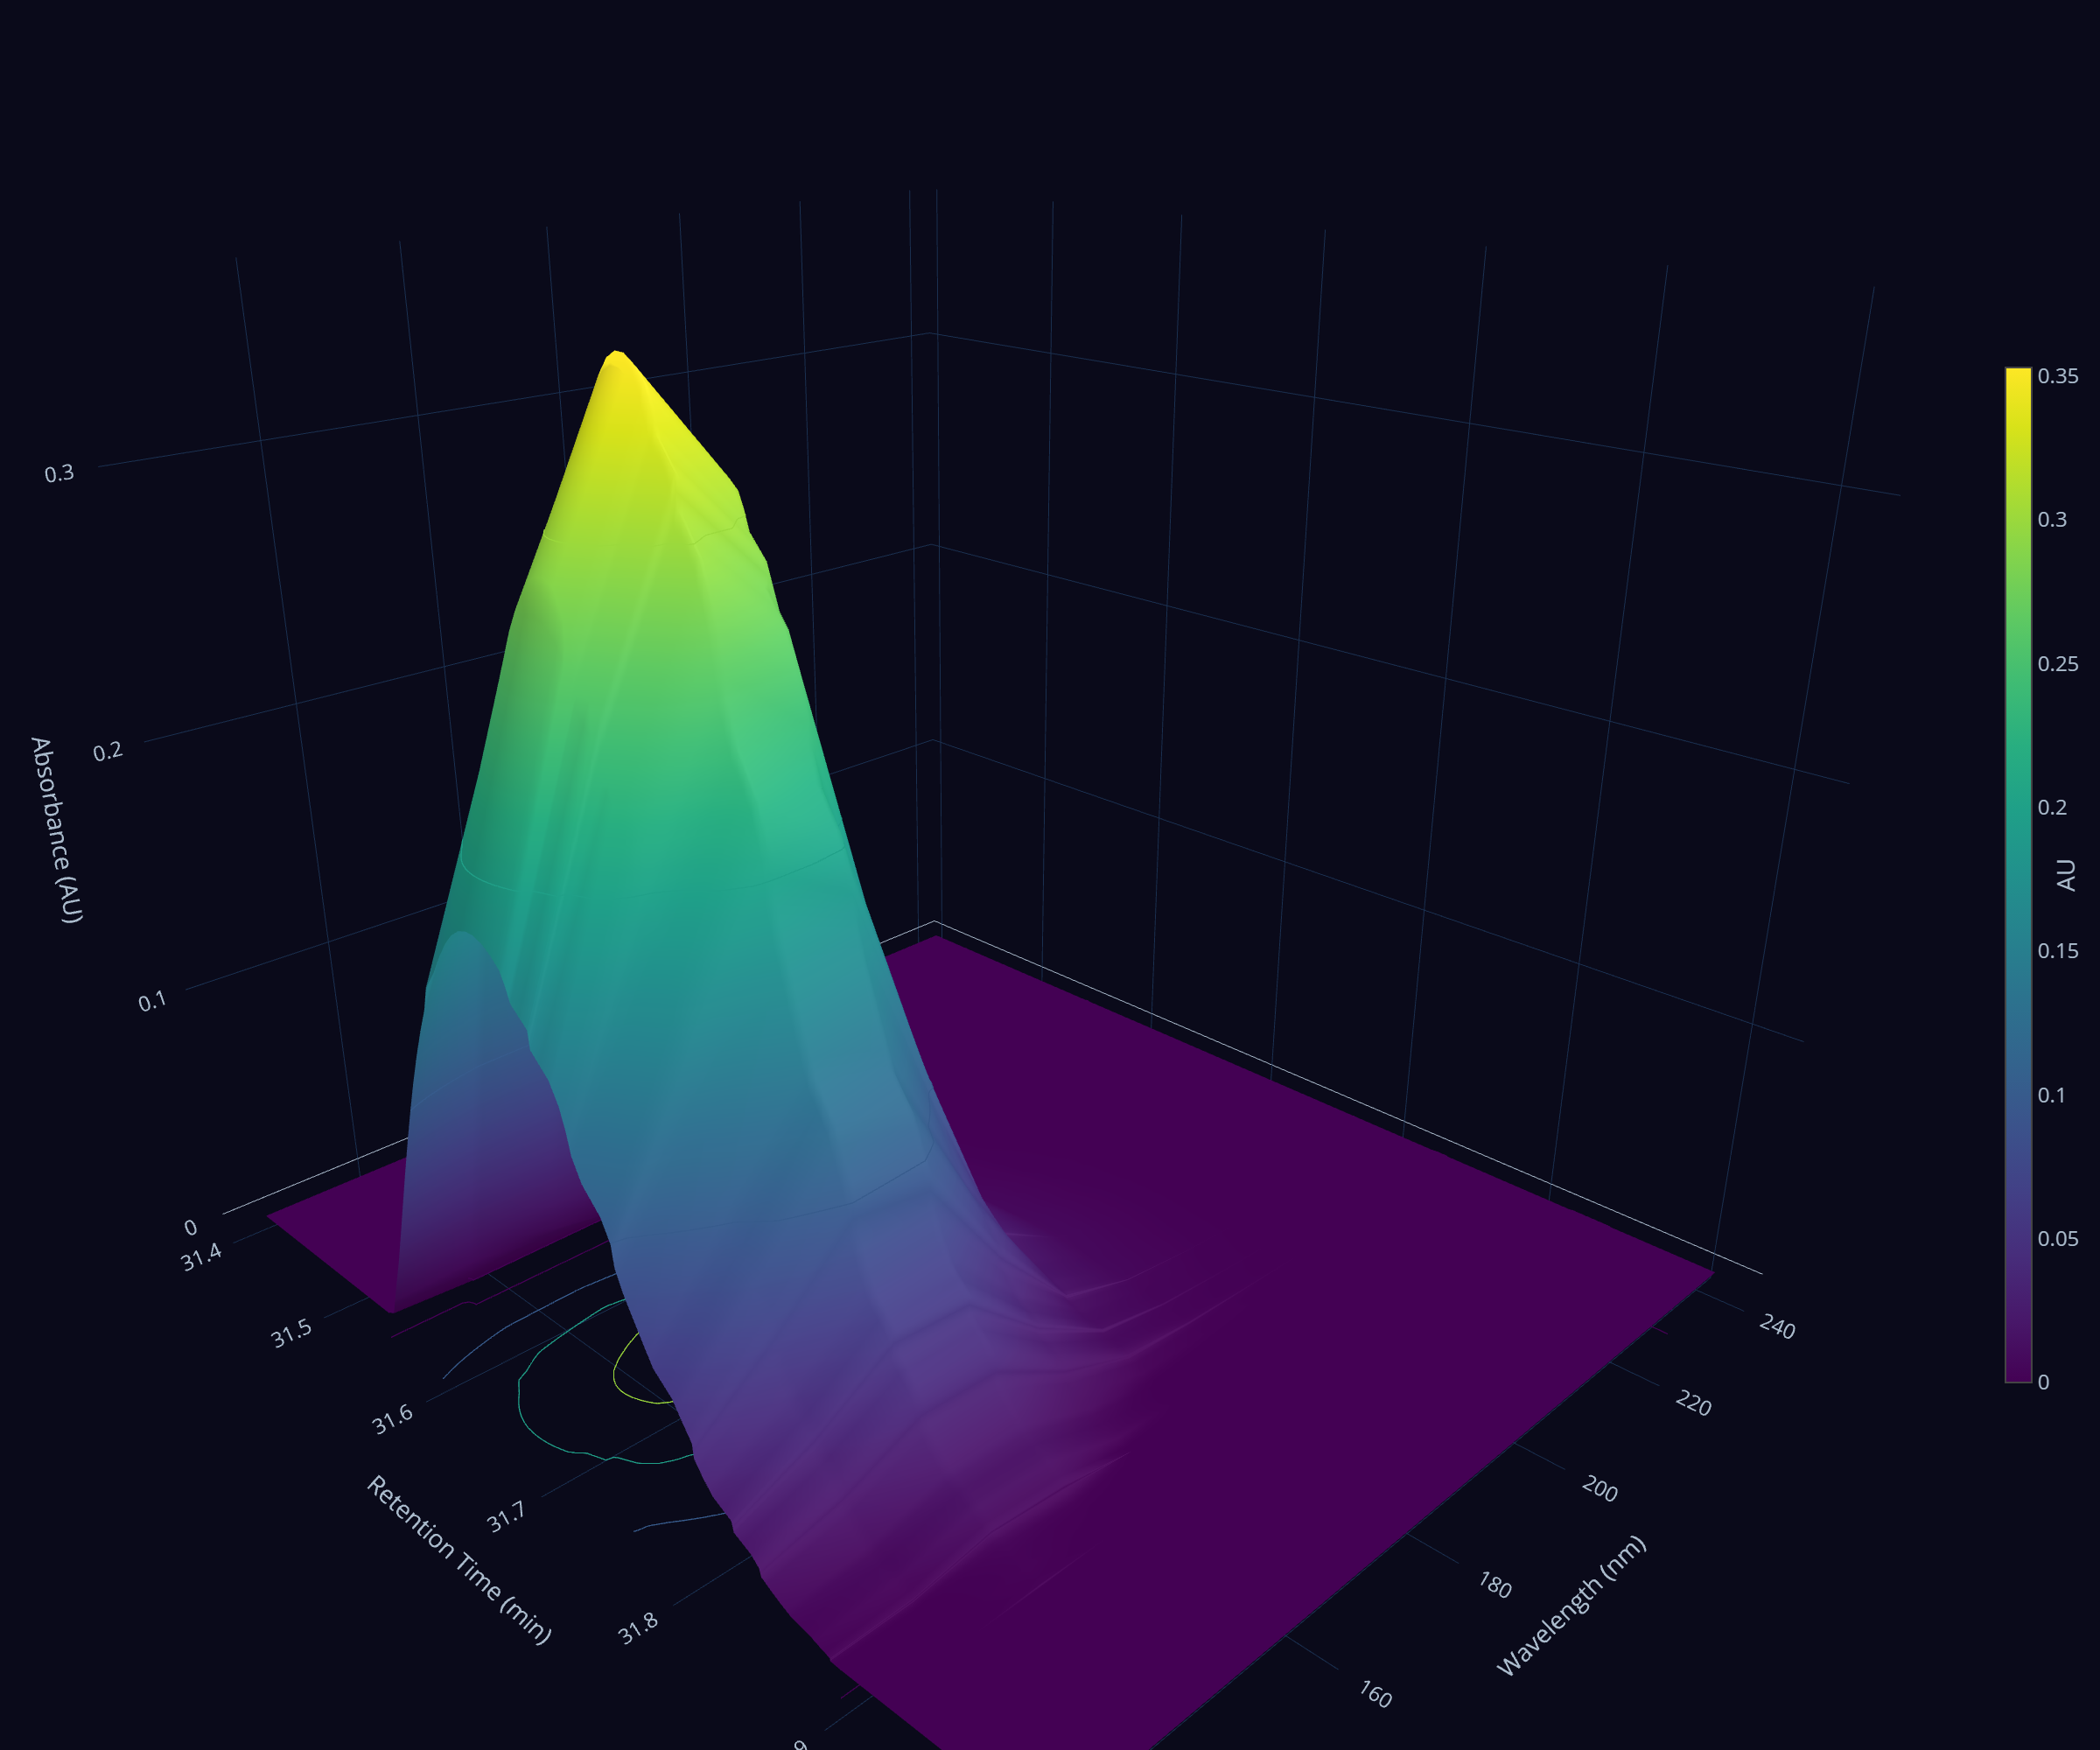
Twelve planes, brought onto one.
Straight off the instrument, the 12 bands don't line up. Each one carries its own baseline — its own drift from column bleed, oven ramp, and lamp — so the bands sit at different levels, on twelve different planes. The chemistry is buried in the tilt, and to the eye it can look like noise on a slope.
Bring every band down onto one common plane — correct the baselines, put them on the same footing — and something happens: the molecule stands up as one coherent shape across all twelve bands at once. A real molecular absorption is consistent across the bands. Random noise is not. That difference — coherence — is the whole idea, and it's what lets you trust a peak that's barely above the baseline.
Separated by color, not just by time.
When two compounds elute at the same moment, a single-channel detector sees one merged peak and is stuck — the only way to tell them apart was to make them not overlap, which is what the whole 100-meter-column game is about.
But if two coeluting compounds have different spectra, the merged signal is just a weighted sum of two known fingerprints. In principle you could solve that mixture and recover both — and how much of each. It's a potential path to trading some chromatographic resolution for spectral resolution — where the spectra differ enough. When they don't, the split has to be flagged uncertain rather than guessed.
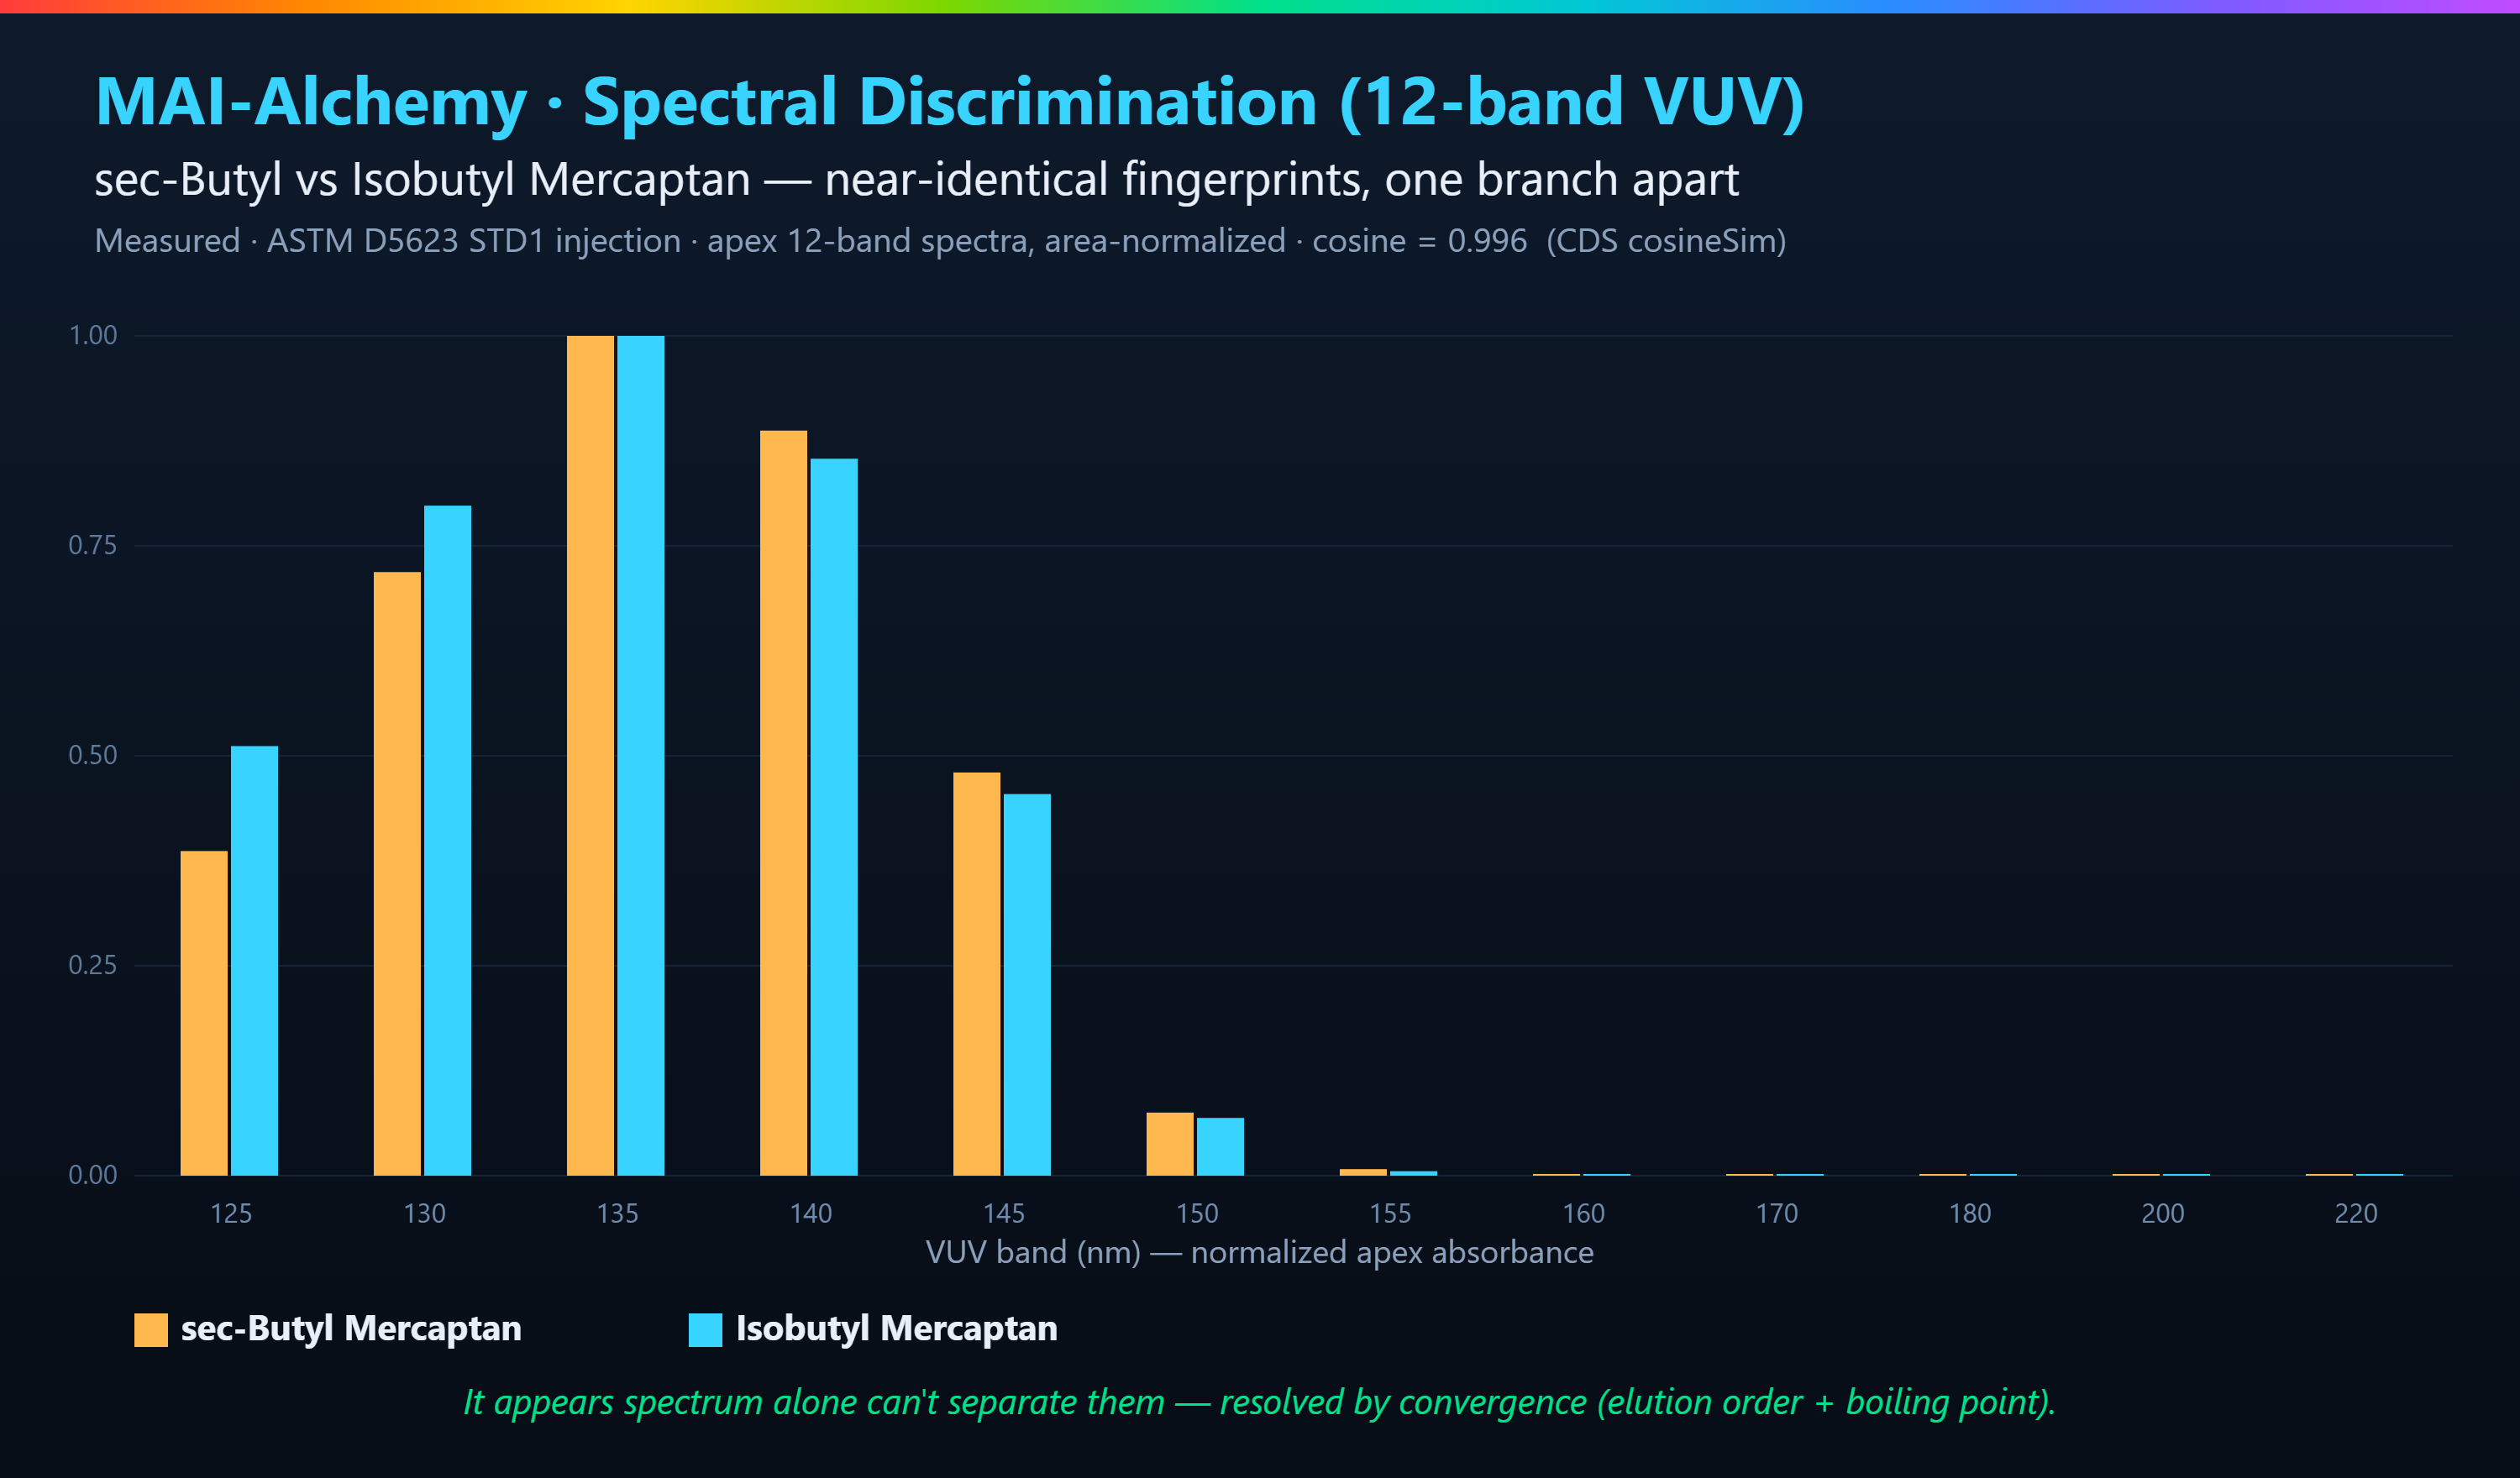
Spectra aren't magic. Saturated hydrocarbons — and some sulfur species — have only single bonds, so they all show nearly the same σ→σ* pattern. The spectrum alone can't always tell them apart. I call it the σ-wall. You don't beat it with a better spectrum; you beat it with more physics: the compounds still elute in a fixed order, and they still boil at different temperatures. Spectrum tells you the class; elution and boiling point tell you which member. Saying so plainly is the difference between a tool you can trust and one you can't.
Beer's Law — and a volume, not just an area.
None of this floats free of physics. Absorbance follows Beer's Law — A = ε · l · c — where ε is the molecule's molar absorptivity (specific to it, at each wavelength), l is the fixed path length of the flow cell, and c is concentration. In each of the 12 bands, that linear relationship holds. It's the foundation that makes VUV quantitative at all. [2]
And because the data is 3D, you can integrate a peak the way GC×GC already does. In two-dimensional GC, a peak isn't an area under a curve — it's a volume over a 2D region, and integrating that volume is standard, powerful practice. LUMA hands you the same opportunity on the spectral axis: integrate absorbance across both retention time and wavelength — a true double integral, ∬A(t,λ) dt dλ — so a peak could become a volume instead of a single-band area. The potential: more signal, more robustness to co-elution, better dynamic range. It's the same physics GC×GC already trusts, applied to the dimension LUMA gives you for free — a direction we're exploring, not a finished result. [3]
The spectrum knows the compound's physical properties.
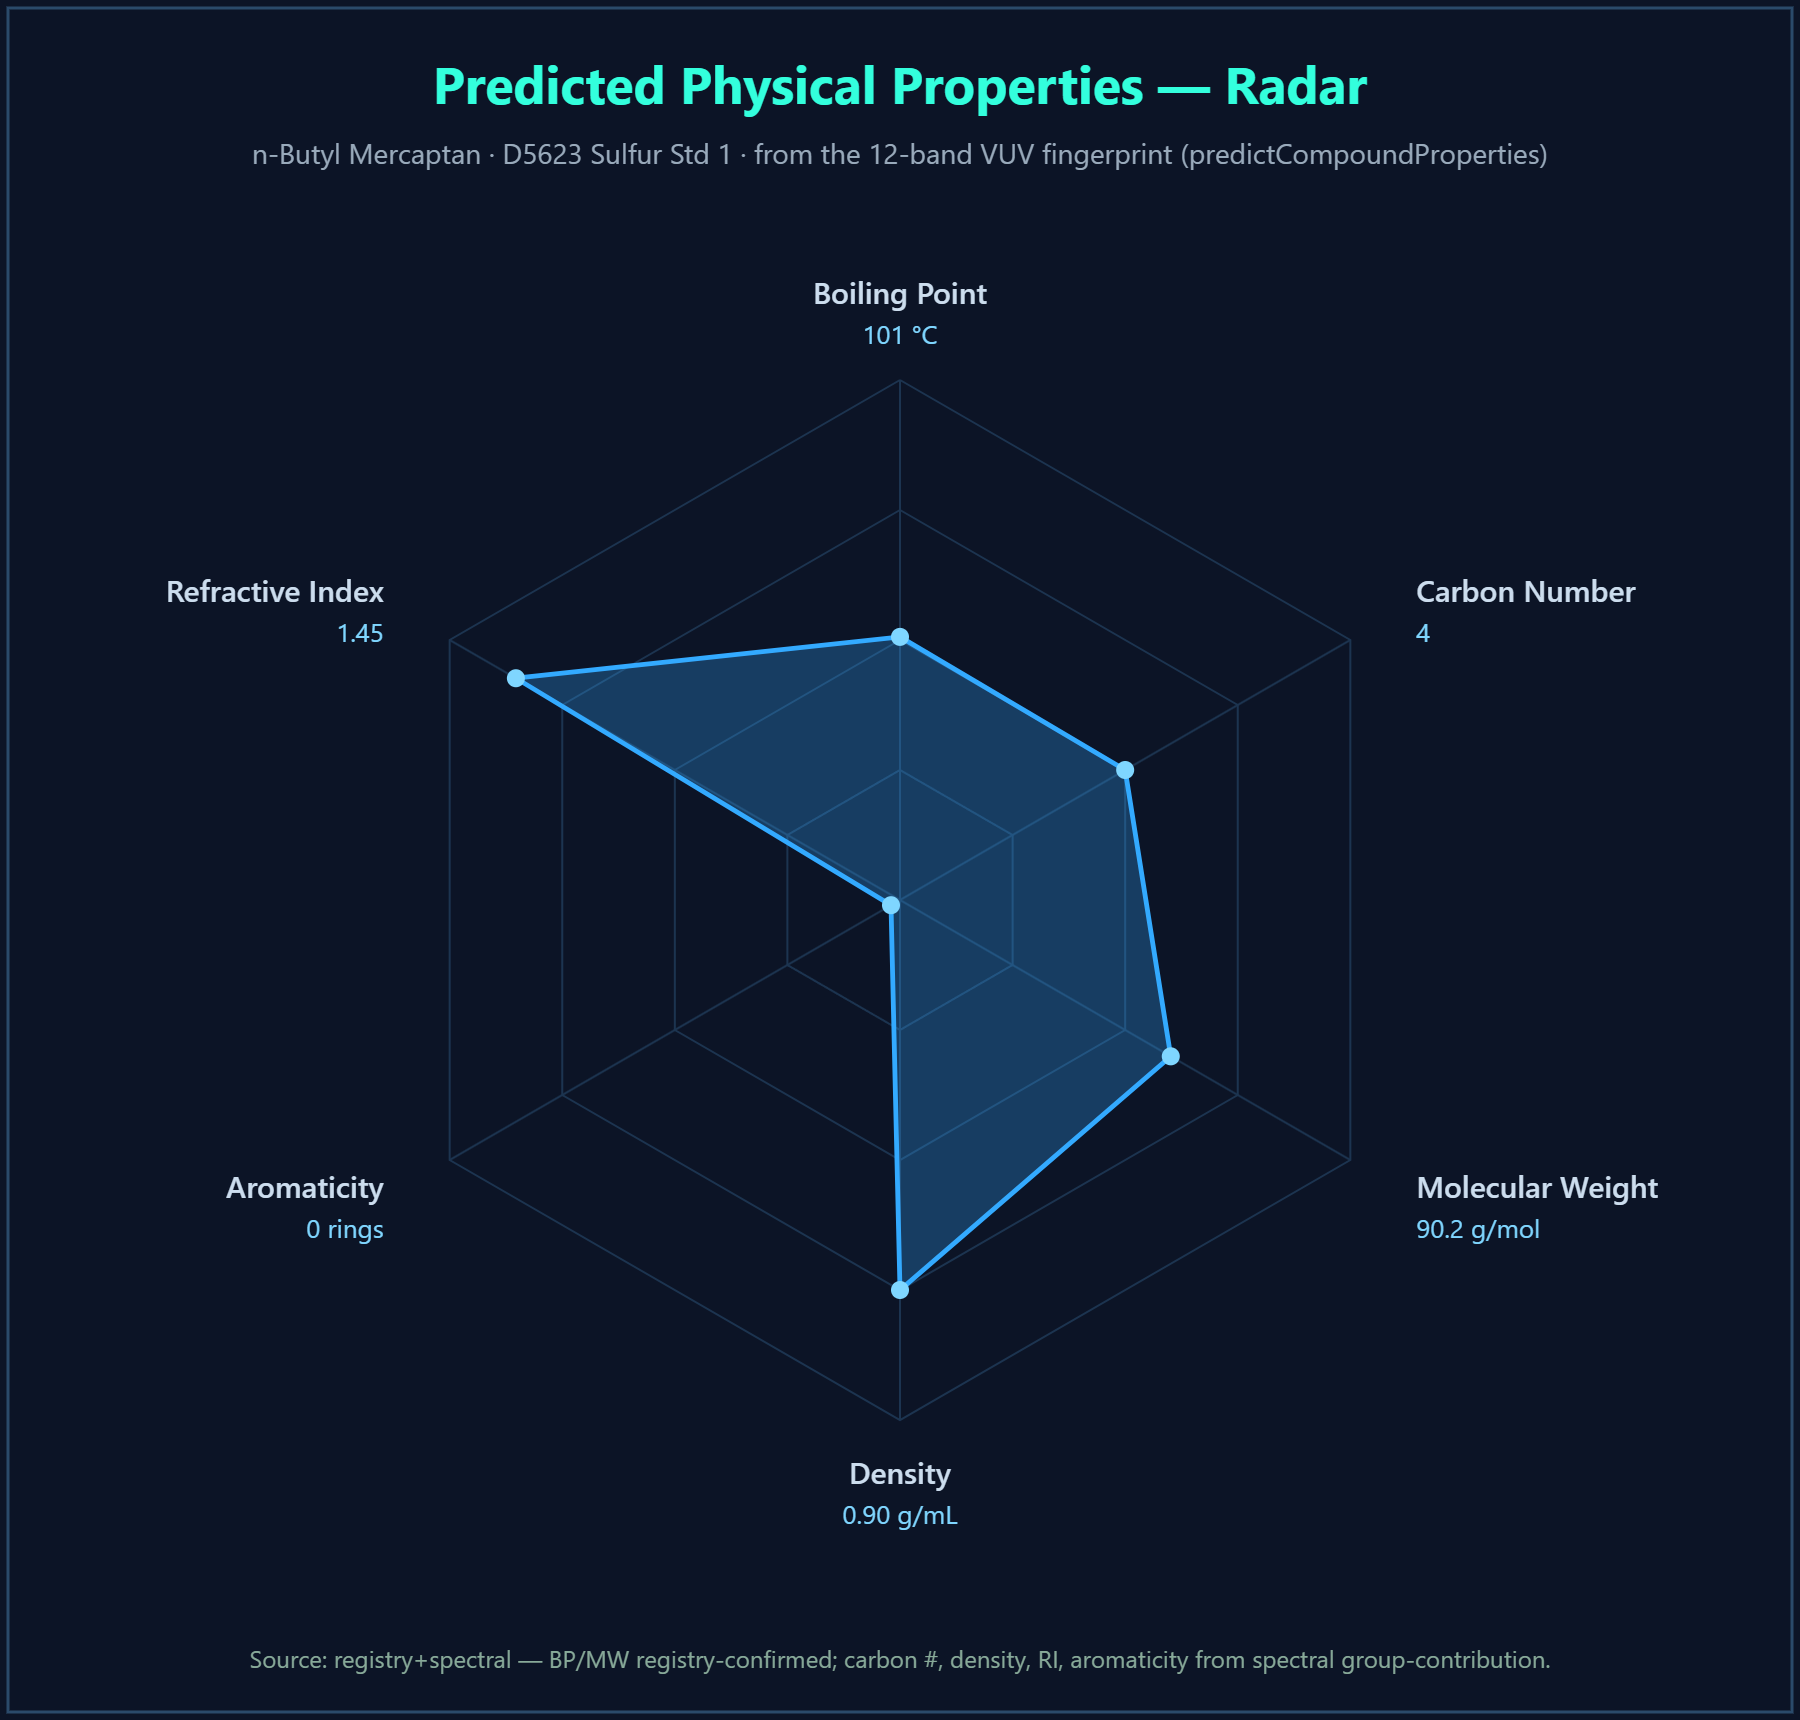
Here's where it stops being a detector and starts being something bigger. The same structural features that shape the fingerprint — chain length, rings, double bonds, heteroatoms — are the same features that set a molecule's boiling point, how it sticks to a column, its density, its weight. Fingerprint and properties appear to be two views of one underlying structure — which is why we think one might, in part, predict the other.
I'll be precise about how far that goes, because credibility lives in the caveats. Retention index — the elution-order anchor — is rigorous, grounded in real chromatographic physics. Boiling point and density are strong within a chemical family and looser across families. That's not a weakness to hide; it's the honest shape of the science, and it's exactly why the platform reasons per family instead of pretending one universal curve fits everything.
And because VUV absorbance obeys Beer–Lambert with an absorption cross-section that is an intrinsic property of the molecule, response looks close to universal — which raises a question worth chasing: could you weigh a compound largely by its spectrum, with far less calibration than you're used to? That's an open direction, not a delivered feature. It would be pseudo-absolute at best — the molecule's ε carried in the library, always anchored and checked against certified standards. It's under development, and it upends a habit worth questioning:
A potential path: any GC + LUMA toward DHA-class analysis — and beyond.
Detailed Hydrocarbon Analysis means identifying and quantifying every hydrocarbon in a fuel; PIONA sorts them into paraffins, isoparaffins, olefins, naphthenes, and aromatics. Traditionally it's brutal — because time is the only ruler, you need a 100-meter column and hours per sample to baseline-separate hundreds of compounds, many with nearly identical boiling points.
Give the detector a spectral ruler too, and the calculus could change. Where compounds overlap in time, their fingerprints might resolve them — so a shorter, faster column could, in principle, speciate a fuel that used to need a 100-meter column and hours per sample. And the same injection that reproduces the legacy number — say, total sulfur — could also surface the breakdown the legacy method threw away. That's the potential we're exploring — an early direction, not a proven claim.
Same physics, two forms.
People mix these up. Both are VUV Analytics detectors, built on the same VUV physics. The VGA captures the full spectrum across roughly 120–240 nm — hundreds of wavelength points. The LUMA delivers a 12-band reduced version of that same information. LUMA is the newer, less-understood form — and its 12-band export is exactly the data most software doesn't know how to read. That's the data I built for.
Maybe it was never a black box. Maybe it was waiting for the software.
The detector appears to carry molecular structure. It appears to encode physical properties. It appears to hold coeluting compounds apart by their color. Much of that looks to have been true the day it shipped. What seems to have been missing is a way to read it — built by someone who thinks like a chemist, not a curve-plotter.
That's what MAI-Alchemy is trying to be — early, exploratory, openly under development. And the fastest way to get a feel for LUMA is to put your hands on it.
- VUV Analytics — LUMA Multi-Channel Vacuum Ultraviolet Absorbance Detector: 12 discrete wavelength bands across ~120–500 nm, each configurable as a CDS output channel (represented as an individual chromatogram). vuvanalytics.com.
- Beer–Lambert law — standard spectroscopy references; Mayerhöfer et al., a review of the Bouguer–Beer–Lambert law.
- Peak-volume integration in comprehensive GC×GC — de Godoy et al.; Chromedia GC×GC resources.
- GC-VUV spectra, structure & property work — Qiu et al. (Talanta); Ho Manh et al., machine-learning prediction of VUV spectra (JCIM).
- Peak integration & baseline methods — Snow, "Peak integration demystified"; Lindquist, automatic GC data analysis.
Written from the bench. Figures are real MAI-Alchemy outputs on real LUMA data. Patent pending.